Ship Density
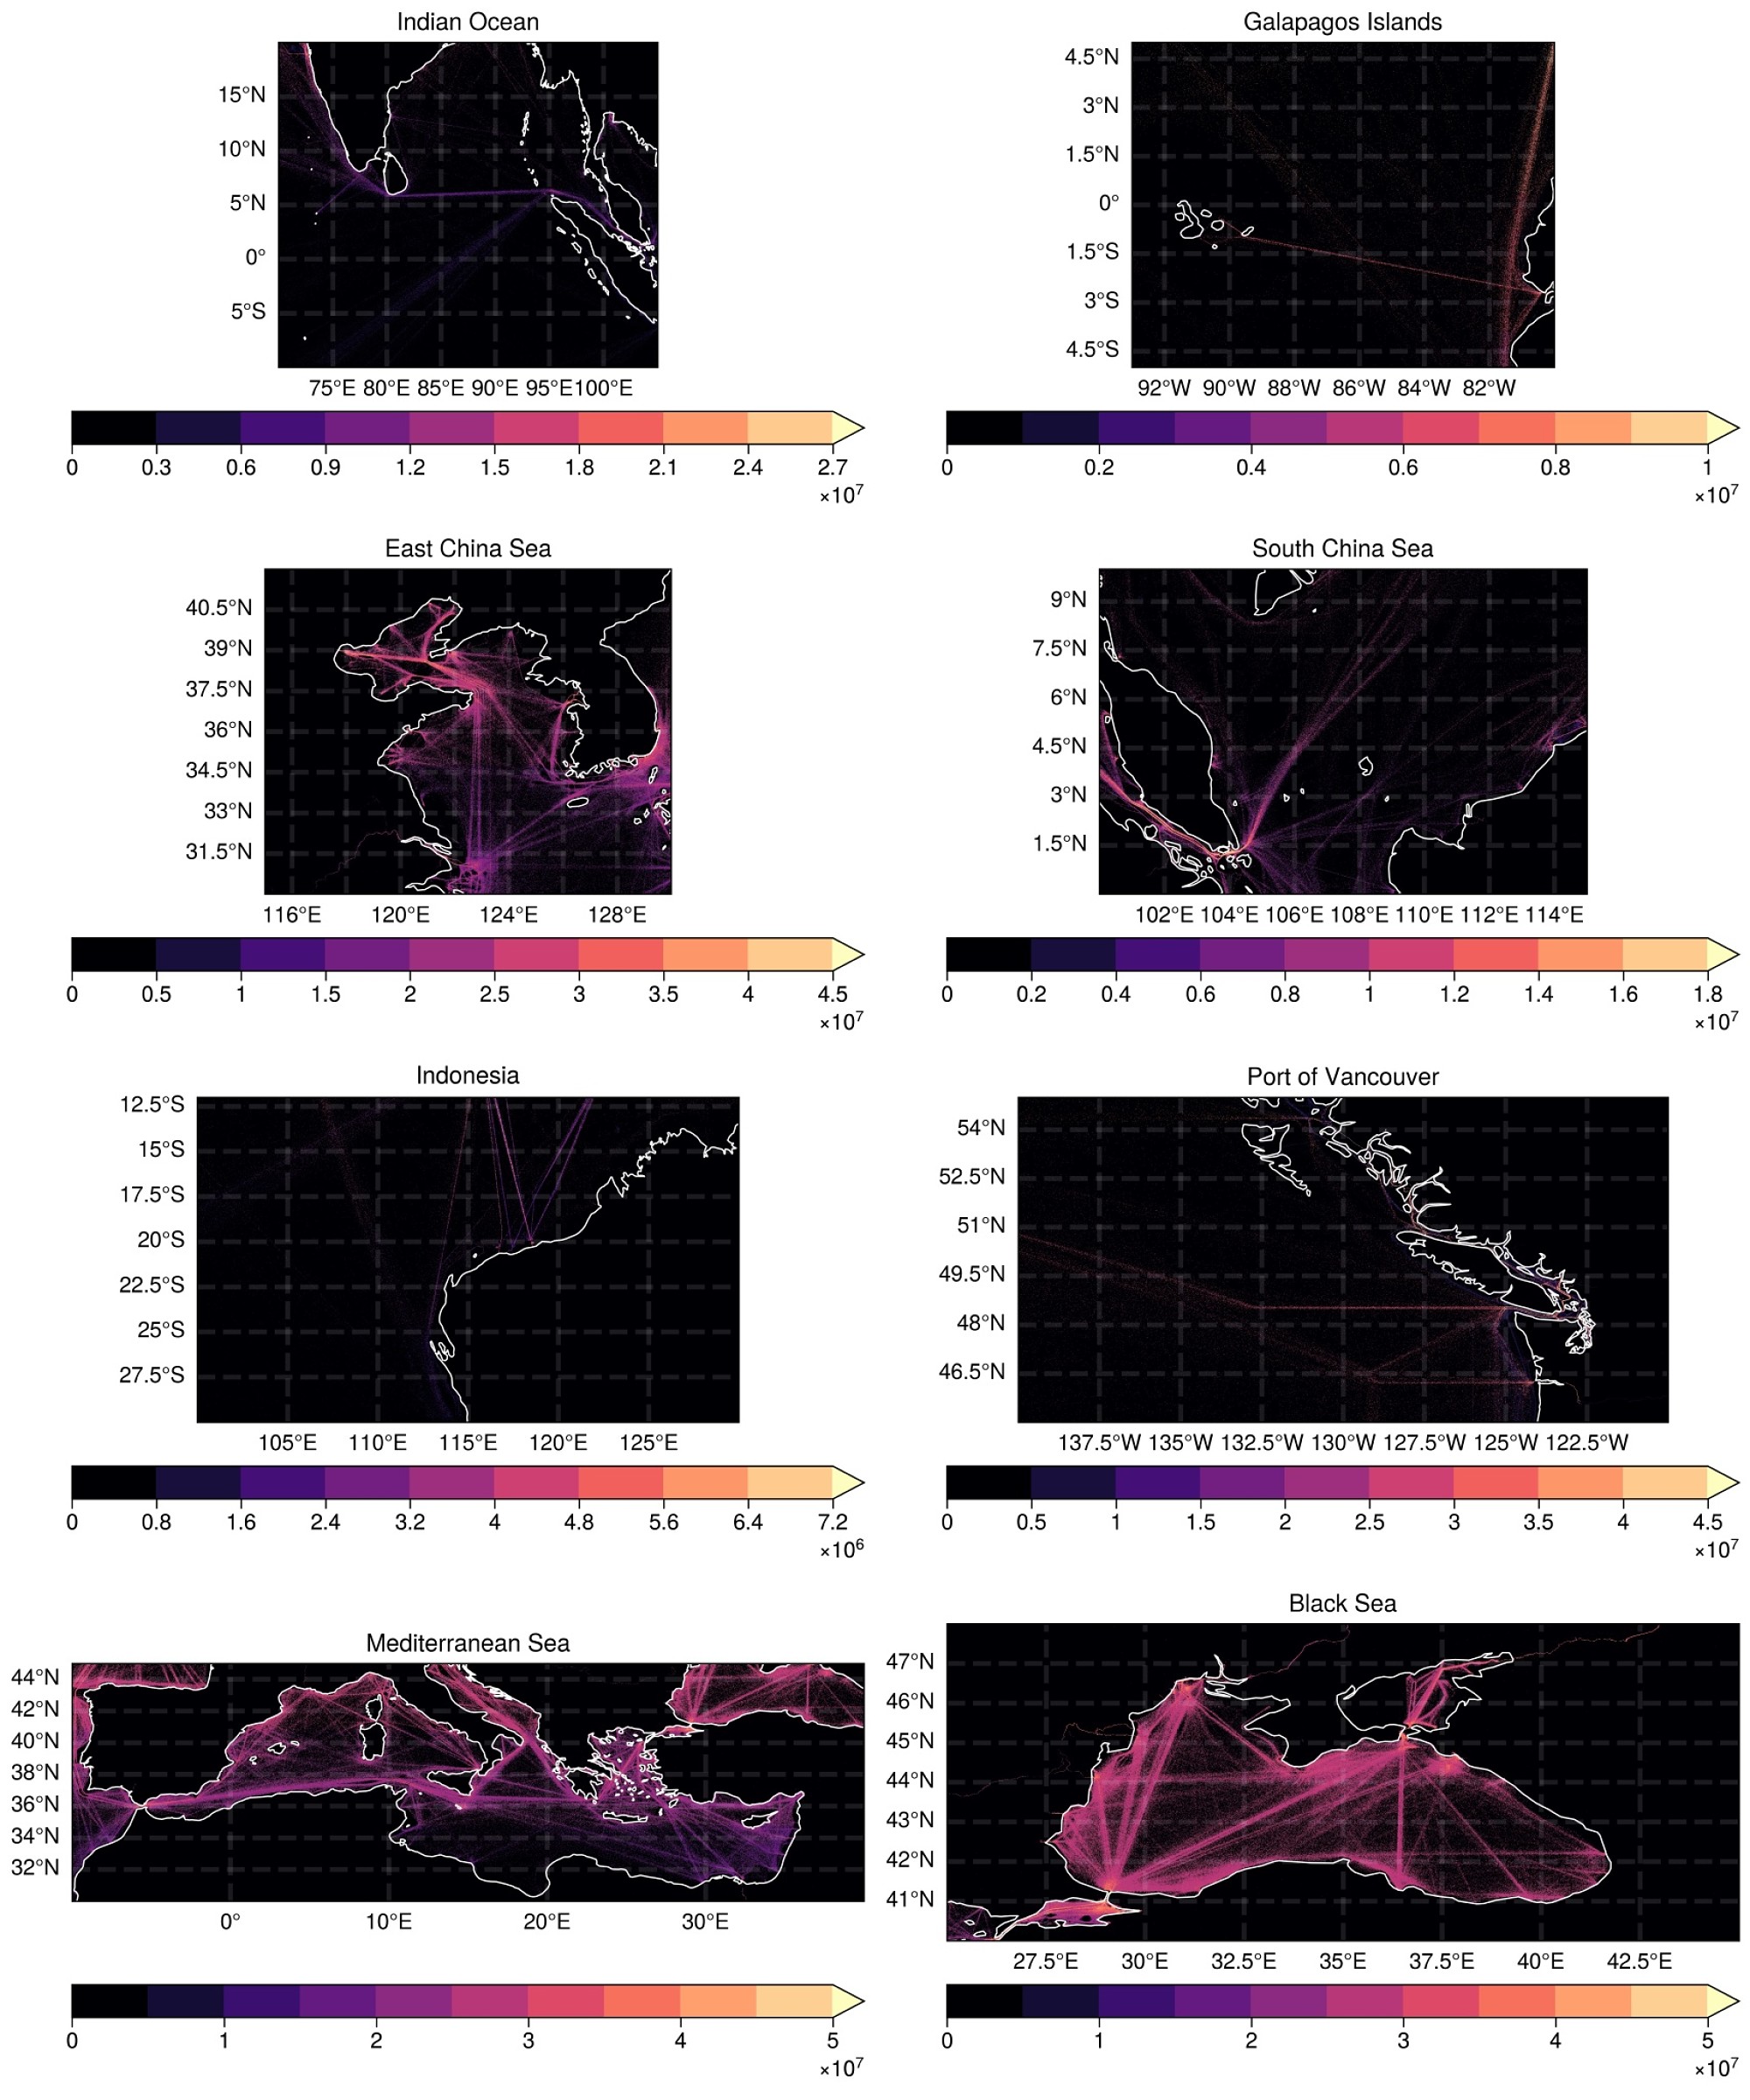
2D Distribution
Main shipping lanes in the world
Here are some shipping lanes over the world. The Global Ship Density source data is ship density from 2015-2020, at 500m resolution.
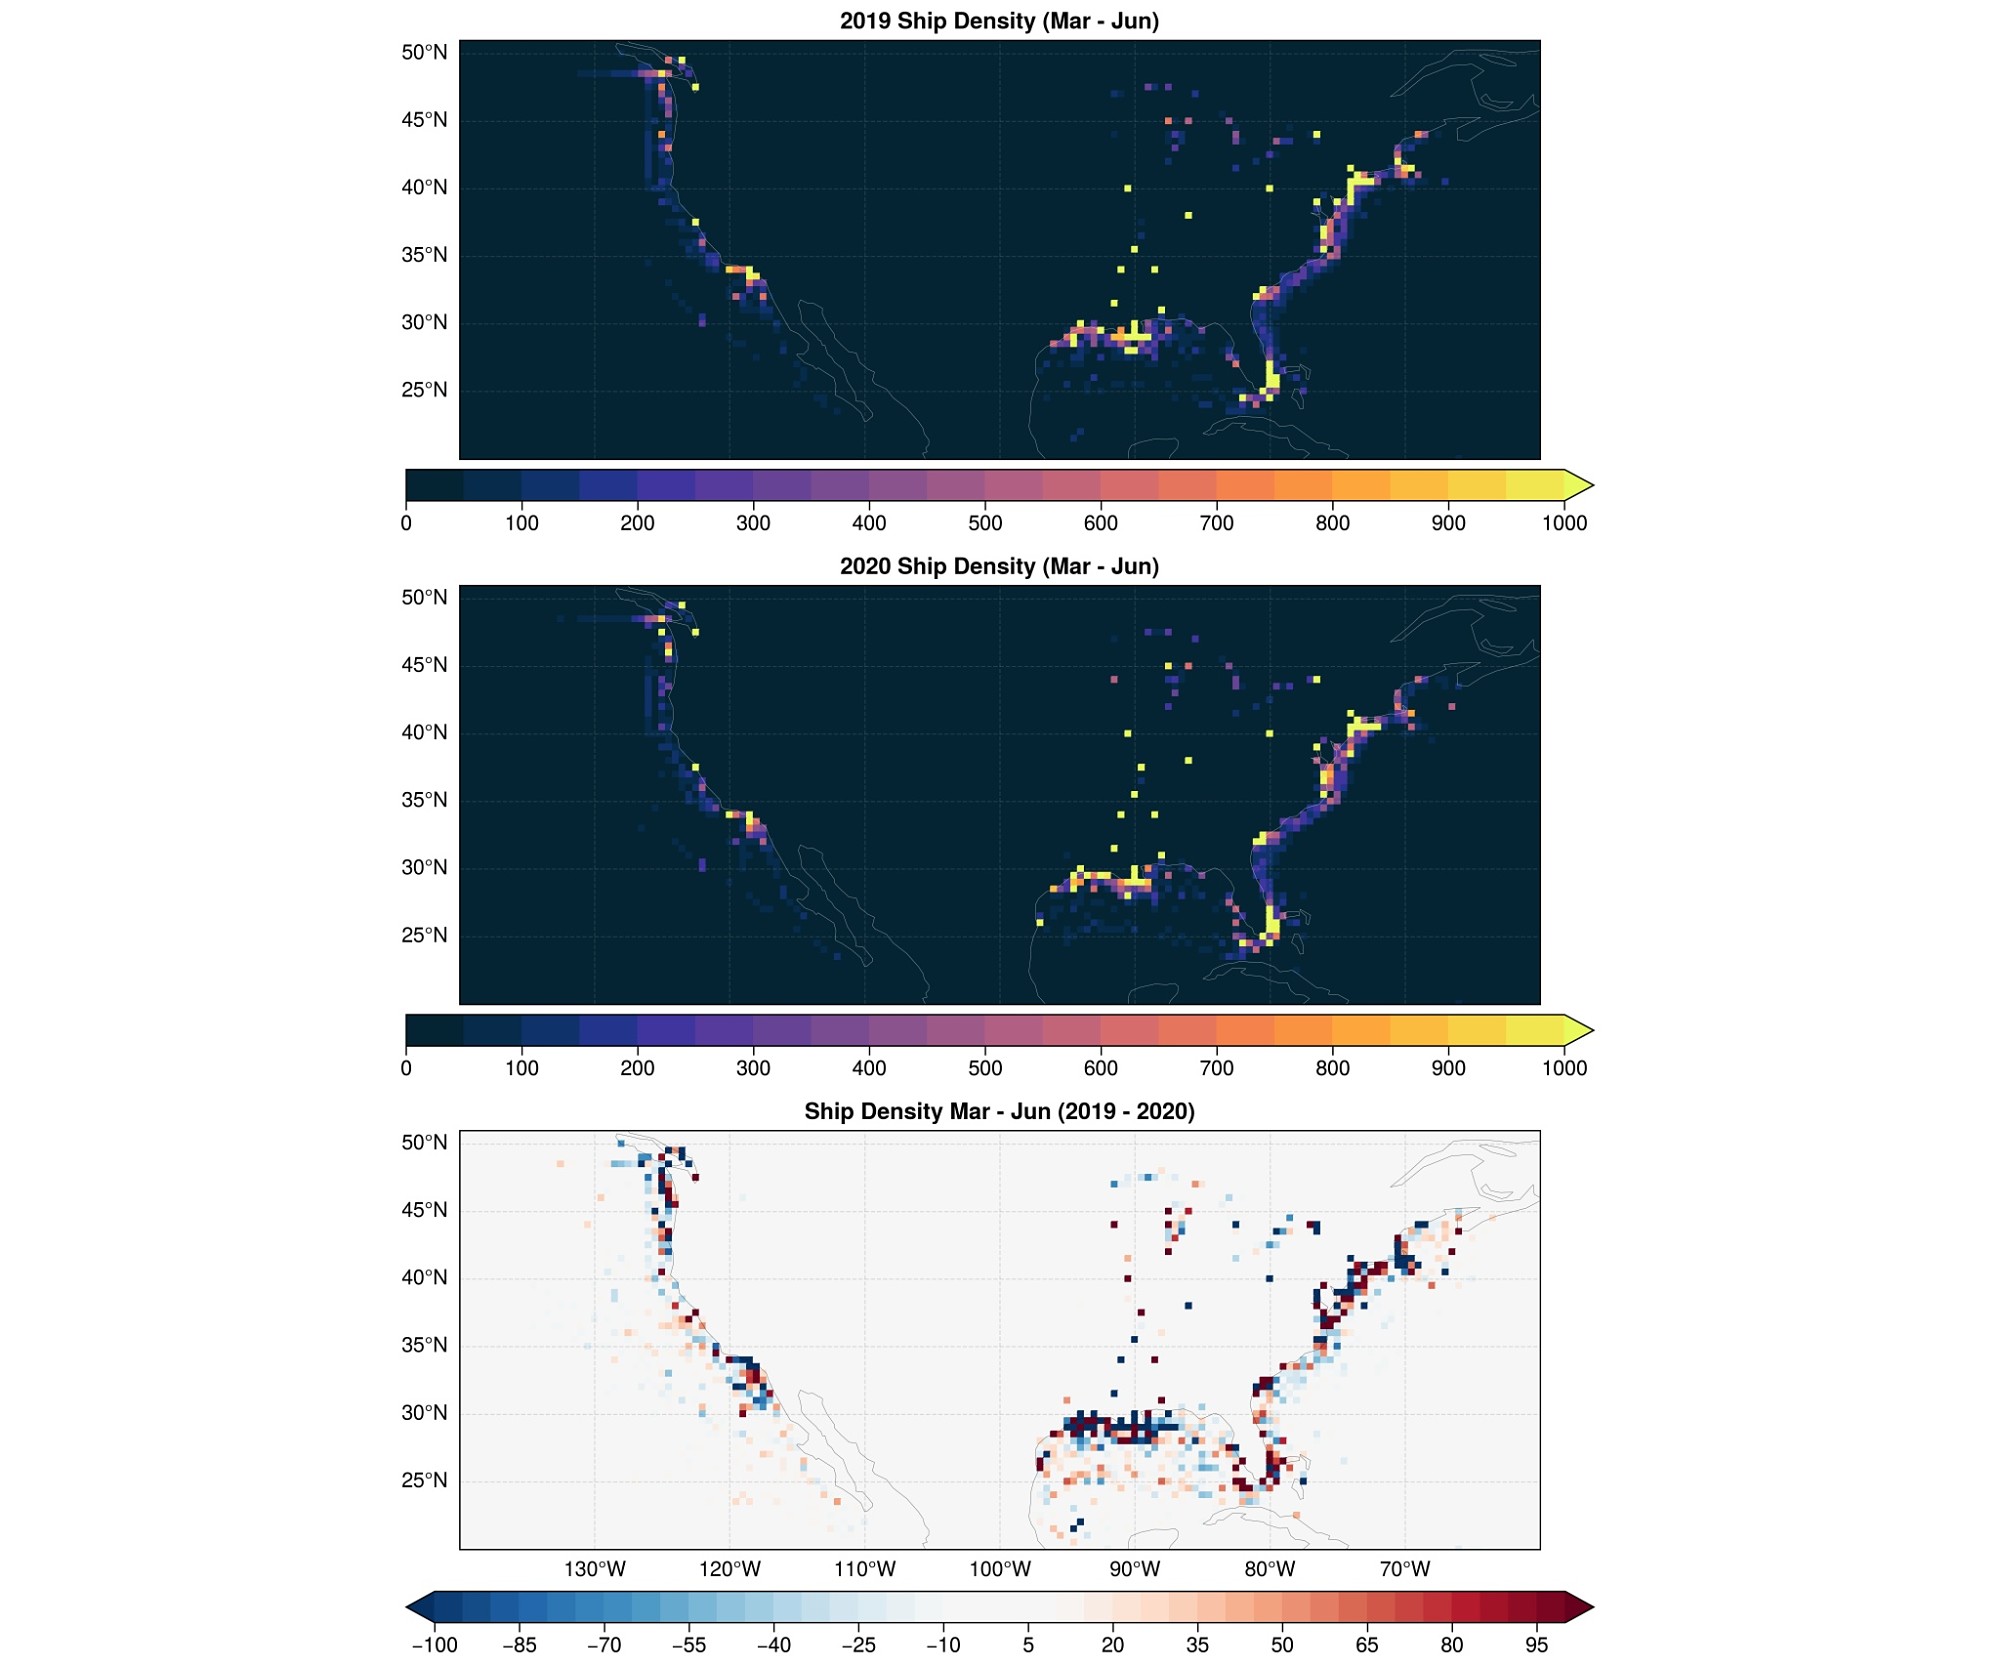
U.S. ship density
As the Global Ship Density dataset only provides the longtime summarized data, we switch to the US Vessel Traffic Data which is the original 2009-2020 AIS data.
Here’s the comparison of ship density before and during the COVID-19 pandemic.
The ship density near the coast decreased during the pandemic, but increased in the ocean.
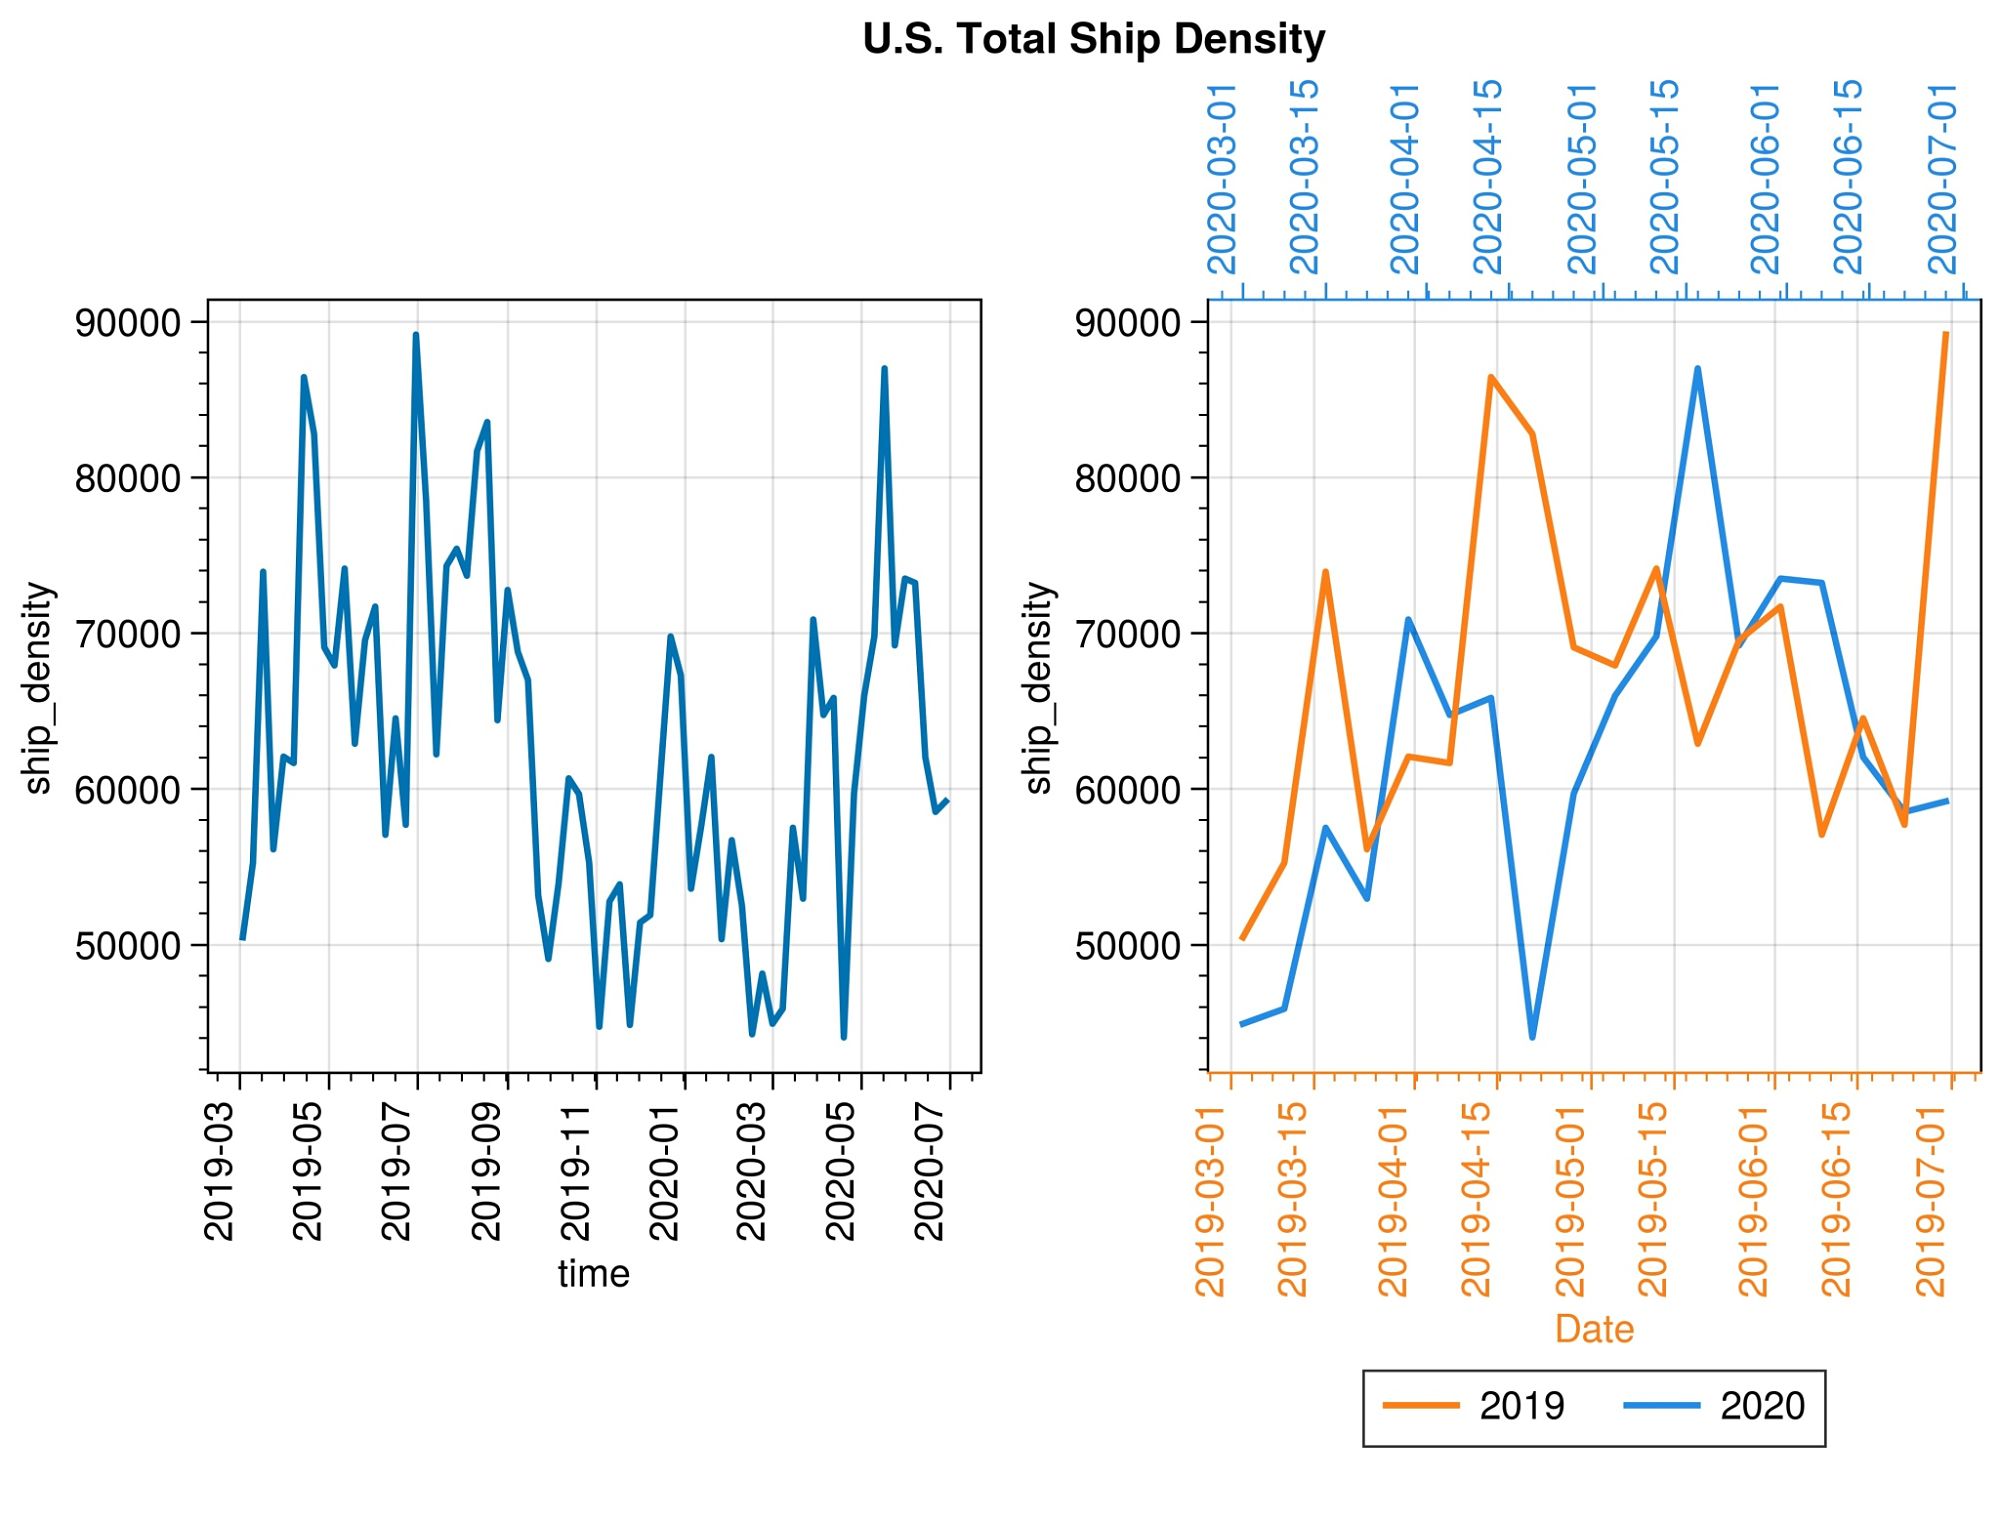
Time Series
Of course, we can also get the seasonal pattern of ship density and the effect of pandemic.
There are more ships in spring and summer.
The most significant different is between 2020-04-15 and 2020-05-15.